Safe Streets and Roads for All (SS4A) Grant Program provides grants for road improvement. The Infrastructure Investment and Jobs Act (IIJA) established the Safe Streets and Roads for All (SS4A) competitive grant program with $5 billion in appropriated funds over 5 years, 2022-2026. The SS4A program funds regional, local, and Tribal initiatives through grants to prevent roadway fatalities and serious injuries. Almost $2 billion is still available for future funding rounds. Eligible applicants for SS4A grants include the following:
- Metropolitan planning organizations (MPOs).
- Political subdivisions of a State or territory (e.g., counties, cities, towns, special districts, certain transit agencies, and similar units of local government).
- Federally recognized Tribal governments.
There are two grant types available:
- Planning and Demonstration Grants for Action Plans, including supplemental safety planning and/or safety demonstration activities
- Implementation Grants.
A comprehensive safety action plan (referred to as an “Action Plan”) is a plan to prevent roadway fatalities and serious injuries in a locality or region or on Tribal land (www.transportation.gov/grants/SS4A). This plan may describe which roads will be repaired and/or additional signage added, and provide statistical and scientific justification why these specific roads were chosen.
Crashhotspots.com provides statistical expertise and consulting to identify traffic accident hotspots. It is critical for municipalities, counties and towns to identify which road segments are the most dangerous—those with the highest probability of traffic accidents leading to death or serious injury. This knowledge is essential for drawing attention to these hazardous areas, understanding the underlying causes of their danger, and ultimately implementing solutions to prevent deaths and injuries. We implement a method for identifying the most dangerous road segments in cities or even entire states using publicly available traffic accident data. By 'dangerous,' we mean segments where the number of accidents statistically significantly exceeds what would be expected if accidents were evenly distributed across the road network. The results can be presented as a road map with dangerous segments highlighted in different colors using geographic information systems (GIS).
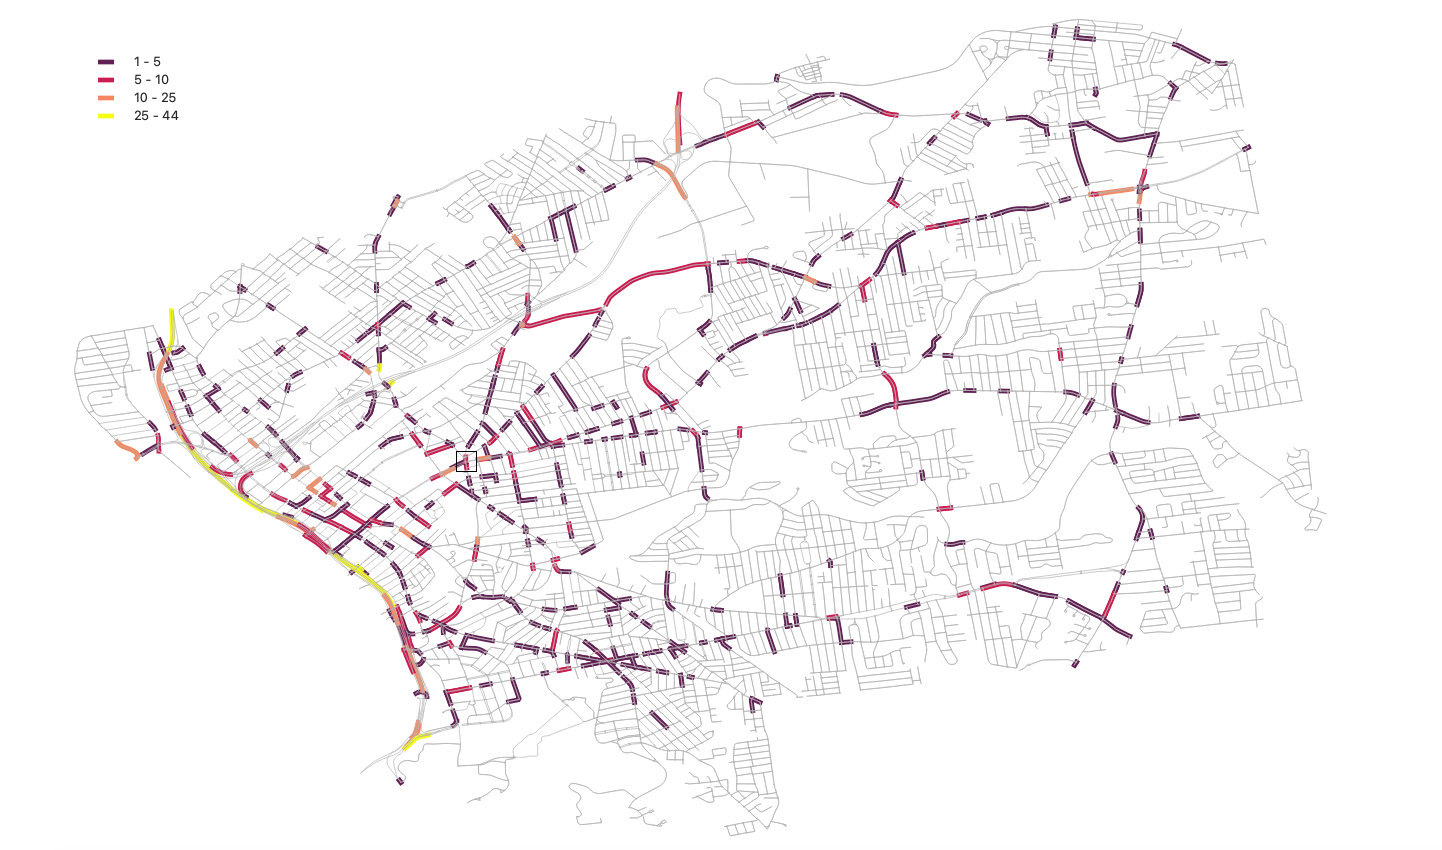
Figure 1. The most dangerous road sections, identified by analyzing data on fatal and non-fatal traffic accidents that occurred in Springfield, MA, between 2021 and 2025. The yellow color corresponds to the most dangerous road segments, where the number of traffic accidents is highest. The darkest color corresponds to the least dangerous road segments, where the number of traffic accidents is lowest. The legend shows how different colors correspond to different numbers of traffic accidents.
The road map in the GIS program can be combined with a regular map to make it clearer which section of the road is being discussed. Figure 2 shows the section of the road network outlined by a small rectangle in Figure 1, but superimposed on a regular map where street names are visible:
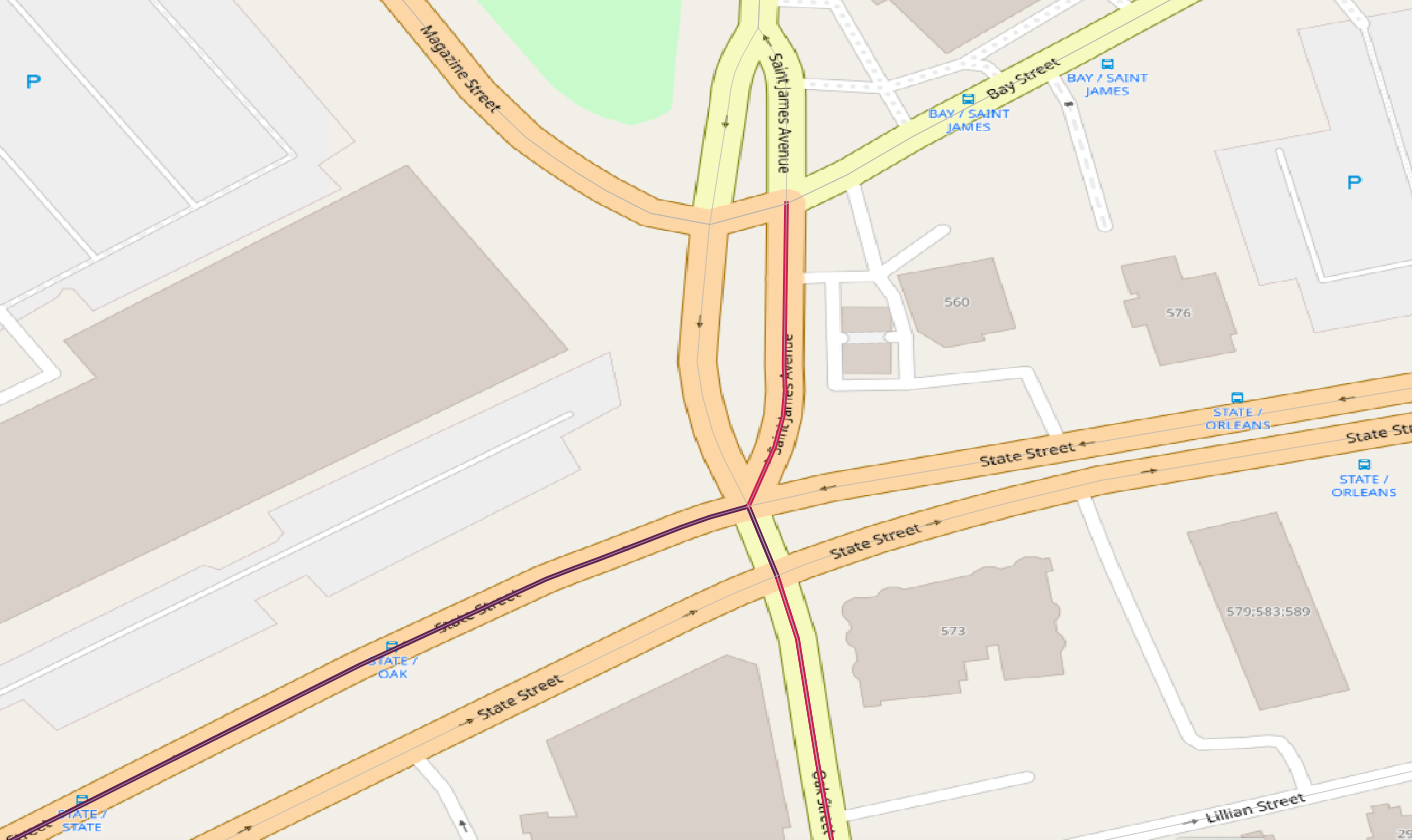
Figure 2. Dangerous sections of the road shown on a regular map.
We perform calculations to identify the most dangerous road sections for any city using accident data from open sources. The results of the
calculations are presented in two ways: as ShapeFile format files:
Significant_edges.cpg
Significant_edges.dbf
Significant_edges.prj
Significant_edges.shp
Significant_edges.shx
And as a text file with the .csv extension.
The ShapeFile format is convenient for display in a geographic information system (GIS). Figures 1-2 show what such a file looks like when loaded into QGIS.
A text file in .csv format can be loaded into a spreadsheet. Its first lines look something like this:
node_start,node_end,key,tas,lat0,lon0,lat1,lon1
1928794390,70087244,0,44,42.1180964,-72.5832267,42.118623,-72.582721
70147105,69999031,0,40,42.0968109,-72.5862889,42.097128,-72.5867136
70226144,70227820,0,37,42.092644,-72.5826374,42.0992809,-72.5901575
70219653,70097668,0,36,42.1201081,-72.5842405,42.12109,-72.584198р
The first line of the file is the header, and the subsequent lines are data. Thus, the first two numbers in the first line after the header 1928794390.70087244 are the numbers of the nodes through which the road segment passes, the next number 0 is the road number, since several road segments can pass through two nodes, followed by 44, which is the number of accidents that occurred on this section. The lines in the file are arranged in descending order of the number of accidents. The next two numbers are the coordinates (latitude and longitude) of the starting node, and the next two numbers are the latitude and longitude of the end node through which the road segment passes.
This resulting technical report would identify streets which have a statistically significantly higher incidence of traffic accidents leading to death or serious injury. It may be included in the Planning and Demonstration Grant proposal and provides a scientific and risk-based rationale for why a specific set of roads has been selected for upgrade. It may also be included as a supplemental safety planning and/or safety demonstration activity.